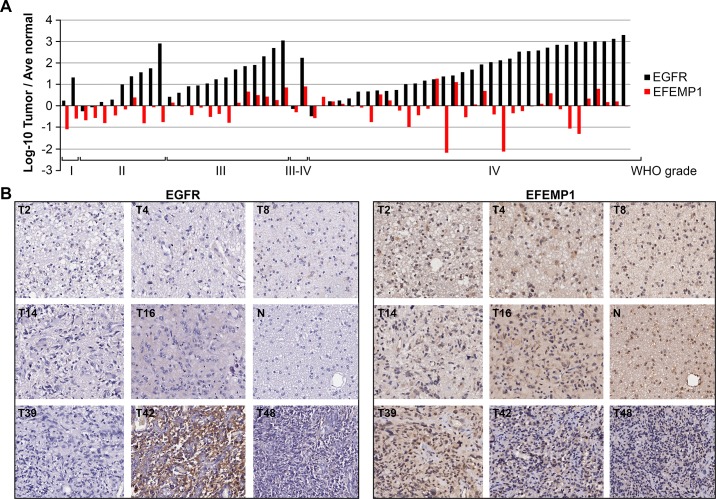
Figure 5. Astrocytic glioma tissue arrays for EGFR and EFEMP1.
(A) Relative immunohistochemical intensity of EFEMP1 (red) and EGFR (Black) in 62 gliomas of various grades, according to the World Health Organization (WHO) grading system, normalized to averages of three normal cortical tissues. (B) Representative images of consecutive tissue sections from grade I pilocytic astrocytoma (T2), grade II astrocytoma (T4) and diffuse astrocytoma (T8), grade III anaplastic astrocytoma (T14, T16), normal cortex (N), and grade IV glioblastoma multiforme (T39, T42, T48).

