
Figure 1.
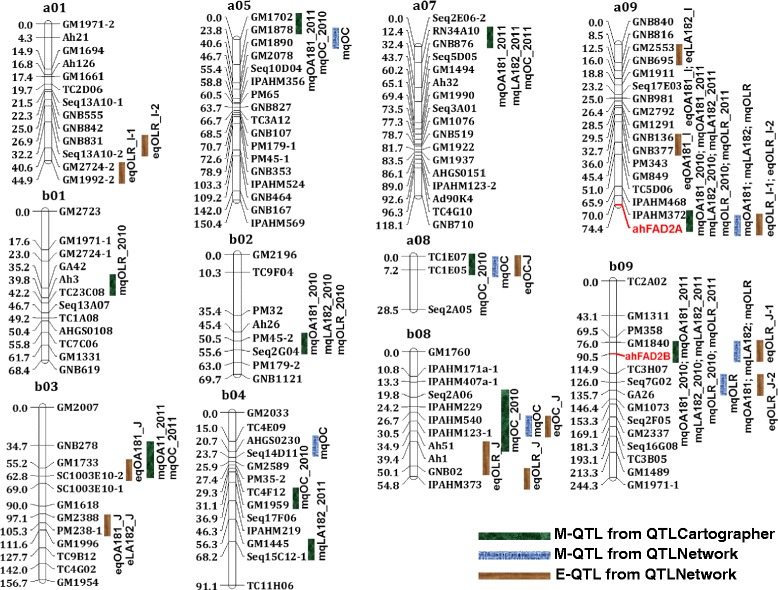
Genetic map of the S-population showing main-effect (M-QTLs) and epistatic (E-QTLs) QTLs for oil content and quality traits. This figure shows positions of 38 M-QTLs detected by QTLCartographer and QTLNetwork while eight E-QTLs detected by QTLNetwork on peanut genome.