
Figure 2.
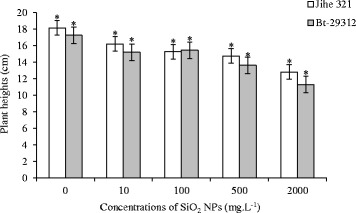
Effects of SiO 2 NPs concentrations on plant height. The value was given as means ± SD. The (*) was represented significant difference (p <0.05) between control and SiO2 NPs treatments at the same cotton, and the (*) above the line segment was represented significant difference (p <0.05) between cultivars at the same SiO2 NPs concentration.