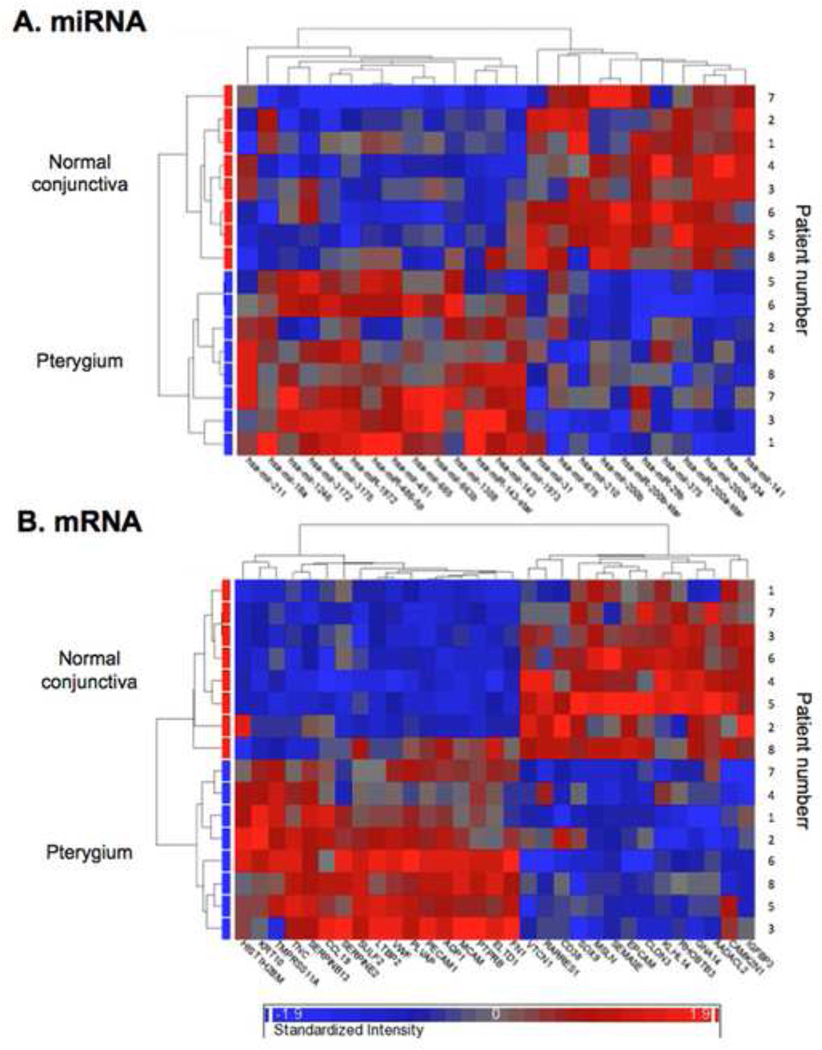
Figure 2. Hierarchical clustering analysis.
Two-dimensional euclidean unsupervised hierarchical clustering analysis of the (A) 25 miRNA probe sets and (B) 31 mRNA probe sets visualized in the form of heat maps. Expression levels are indicated on a color scale where red represents the up-regulated genes and blue the down-regulated genes. The shorter the length of the branches, the more co-expressed the members of the genes are.

