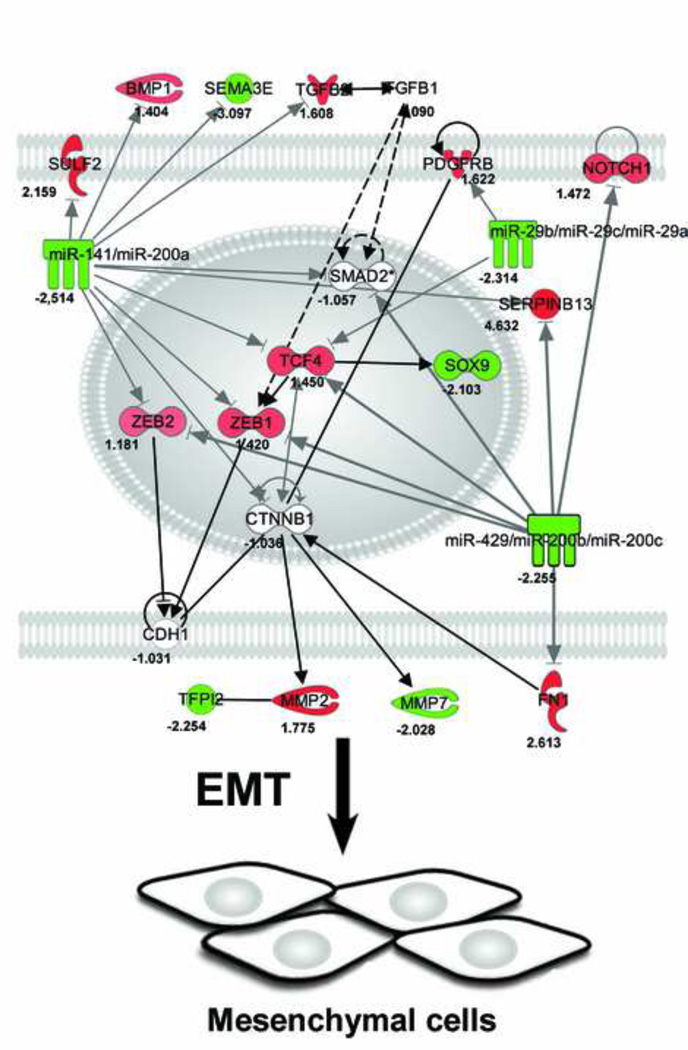
Figure 4. Pathway analysis.
Network demonstrating direct and indirect biological relationships in human primary pterygium. Each node represents a molecule or cluster of molecules, and the intensity of node color in the networks indicates the degree of downregulation (green) or upregulation (red) of gene expression. Arrows indicate the direction of 25 intermolecular actions. The diagram shows important consistencies between the observed downregulation of members of the miR-29 and miR-200 families and targets associated with epithelial-mesenchymal transition (EMT) including activators of EMT such as NOTCH1, TCF4, ZEB1, and ZEB1, and markers of EMT such as MMP2 and FN.

