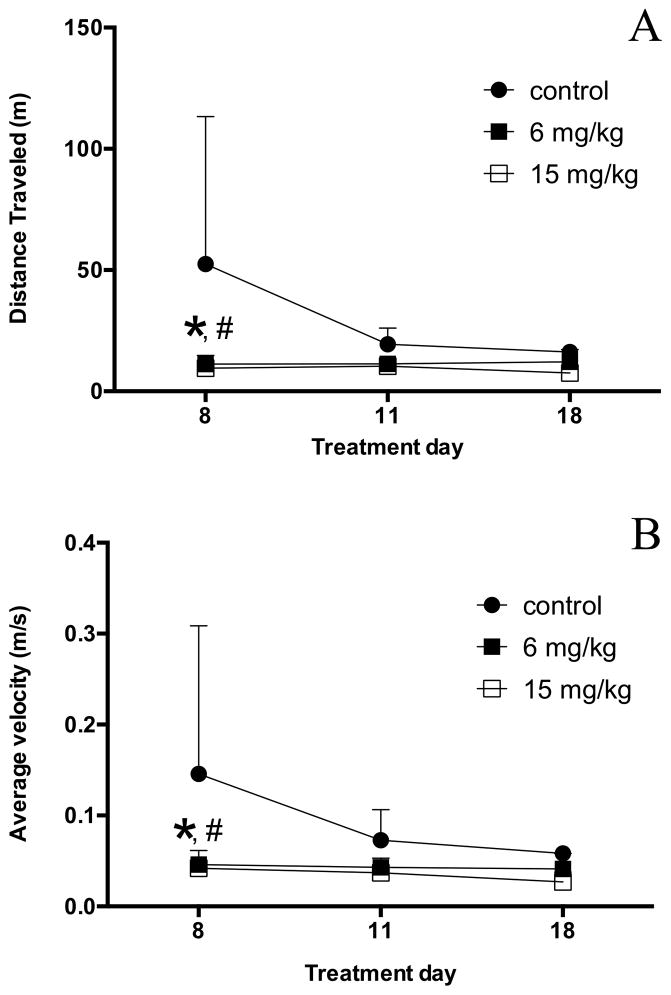
Figure 2.
Open field analysis of locomotor activity. Group averages for distance traveled (A) and average velocity (B) were measured in an open field test on study days 8, 11, and 18. Significant differences were observed between the Mn-treated and control groups by the 8th study day. Two-way ANOVA with Tukey’s post hoc test. Error bars represent SD (n = 3–5). *p<0.05 6 mg/kg/day vs. control, #p<0.05 15 mg/kg/day vs. control.

