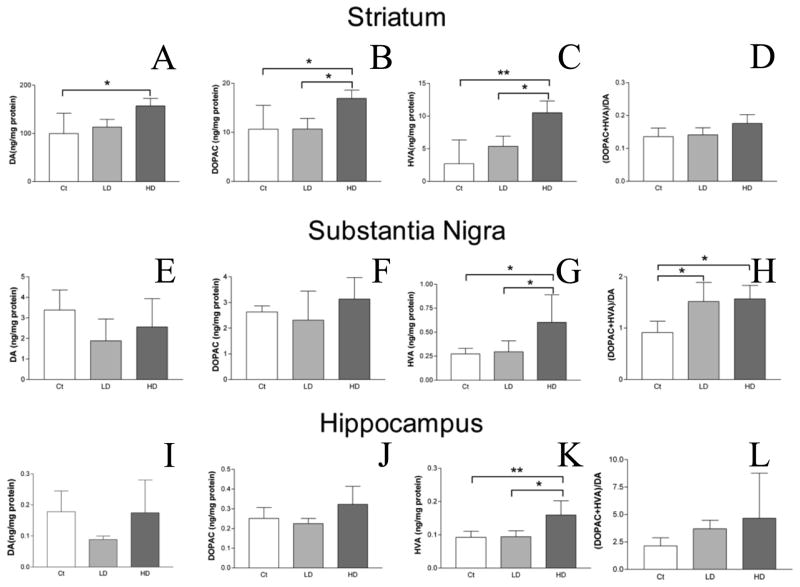
Figure 3.
HPLC analysis of DA, its metabolites, and turnover in rat STR, SN, and HP after Mn treatment. DA (A,E,I), and its metabolites DOPAC (B,F,J), and HVA (C,G,K) were quantified in STR (A–C), SN (E–G), and HP (I–K) by HPLC. DA turnover in each region was calculated as the sum of the metabolites divided by DA concentration (D,H,L). Data revealed significant increase in DA levels in the STR between the control and high dose groups (A). DA metabolites in the STR were also significantly increased between control and high dose groups and between the low and high dose groups (B–C). No difference was observed in DA turnover in the STR (D). While no difference was observed in DA or DOPAC levels in SN (E–F), HVA was significantly increased in the SN between the control and high dose groups and between the low and high dose groups (G). Additionally, DA turnover was significantly increased in the SN between the control and both low and high dose groups (H). No difference was observed for DA or DOPAC levels in the HP (I–J) or DA turnover in the HP (L). Levels of HVA were increased significantly in the HP between control and high dose groups as well as between low and high dose groups. ANOVA with Tukey’s post hoc test. Data represent mean ± SD (n = 4–5). *p<0.05, **p<0.01.

