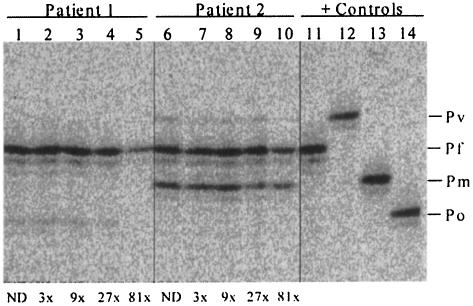
FIG. 4.
Relative differences in Plasmodium species-specific LDR band intensities in individual infected patient samples. Comparison of LDR and blood smear parasitemia results for two infected Papua New Guinean study volunteers. Blood smear results for patient 1 (lanes 1 to 5) reported P. falciparum and P. ovale parasitemias of 360 and 40/μl, respectively. Blood smear results for patient 2 (lanes 6 to 10) reported P. vivax, P. falciparum, and P. malariae parasitemias of 120, 1,720, and 1,040/μl, respectively. LDR analysis of positive control samples: lane 11, P. falciparum (Pf); lane 12, P. vivax (Pv); lane 13, P. malariae (Pm); lane 14, P. ovale (Po). Dilution points are indicated below the panel for each patient (ND, no dilution) and correspond to 0.33 (dilution 3 times), 0.11 (dilution 9 times), 0.037 (dilution 27 times), and 0.0125 (dilution 81 times) of the original genomic DNA preparation. For a starting level of parasitemia in a blood smear of 0.001% (40 irbc/μl), this dilution series would detect parasite DNA to levels of 0.00033, 0.00011, 0.000037, and 0.0000125%, respectively.

