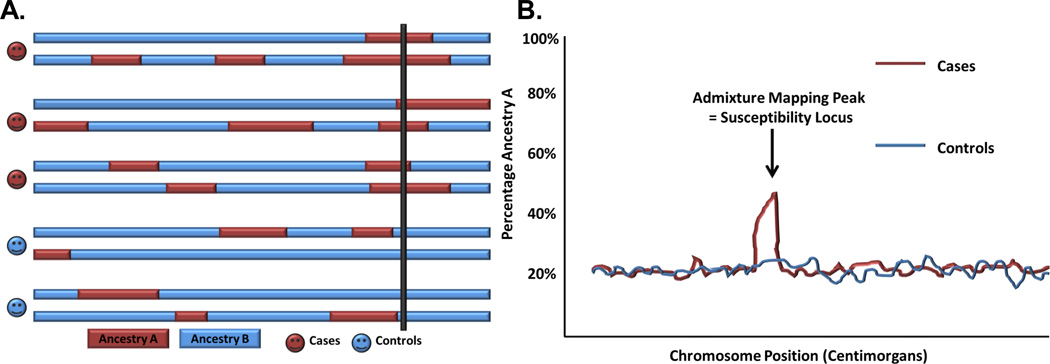
Figure 3. A and 3B: Illustration of Admixture Mapping.
A. The hypothesis behind mapping by admixture linkage disequilibrium or admixture mapping is that chromosomes from an admixed population (shown with darker and lighter colored genetic regions from different ancestries) contain a susceptibility allele which is more frequent in the darker ancestral regions versus the lighter regions. Admixture mapping identifies increased ancestry at a susceptibility locus in affected individuals (region intersected by thick black line).
B. Loci with significant associations between ancestry and disease risk are represented by admixture mapping peaks or chromosomal regions with an overrepresentation of ancestry from the ancestral population, with the highest proportion of risk alleles at the locus containing the risk-invoking variant. Reproduced from Montana G, et al. Am J Hum Genet 2004;75:771–789. and Patterson N, et al. Am J Hum Genet 2004. 74:979–1000 [56, 57].

