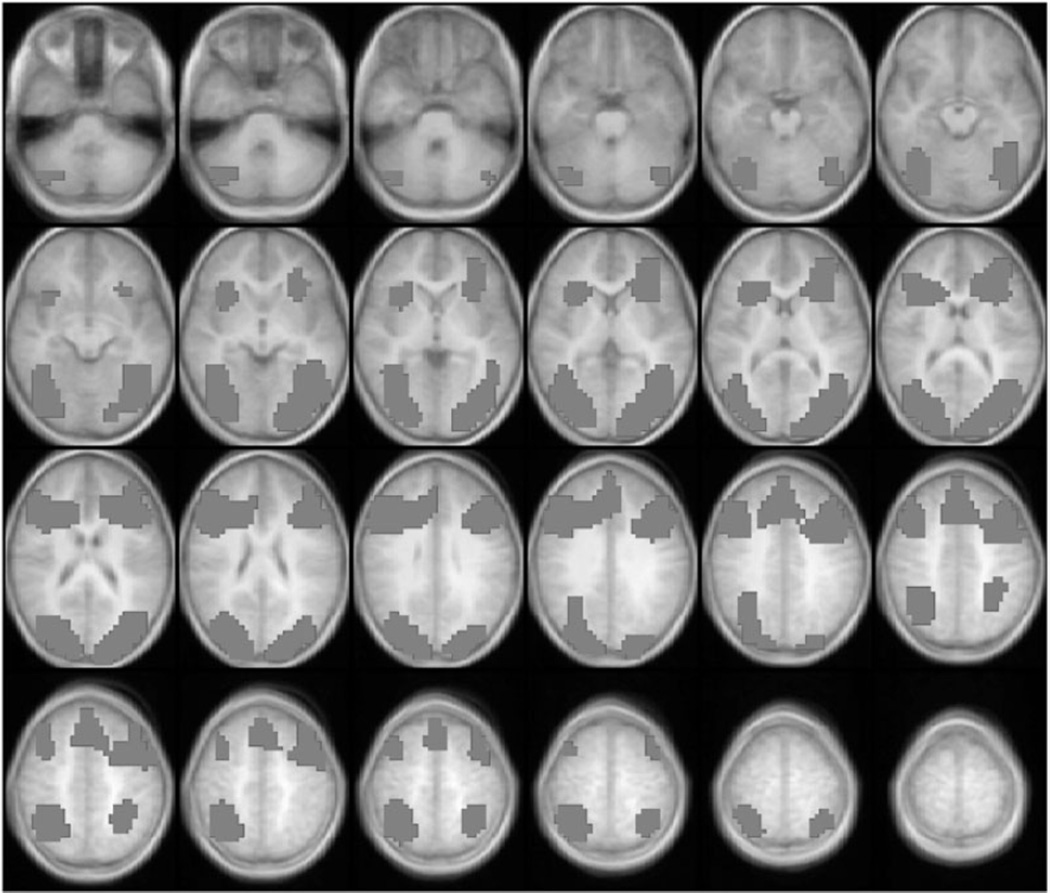
Fig. 1.
Brain activation map for the entire group of participants. Only positive activation foci (CPT > Control) are shown here. Images are horizontal slices 4 mm apart and start at z = −29 mm from the top left to z = +63 mm on the bottom right. Images are in radiological convention: left side of the images corresponds to the right hemisphere. Image parameters are as follows: nominal z = 6.0, cluster = 20, corrected p < .05 for multiple comparisons.

