
Figure 1. Spring-embedded visualization of temperament groups.
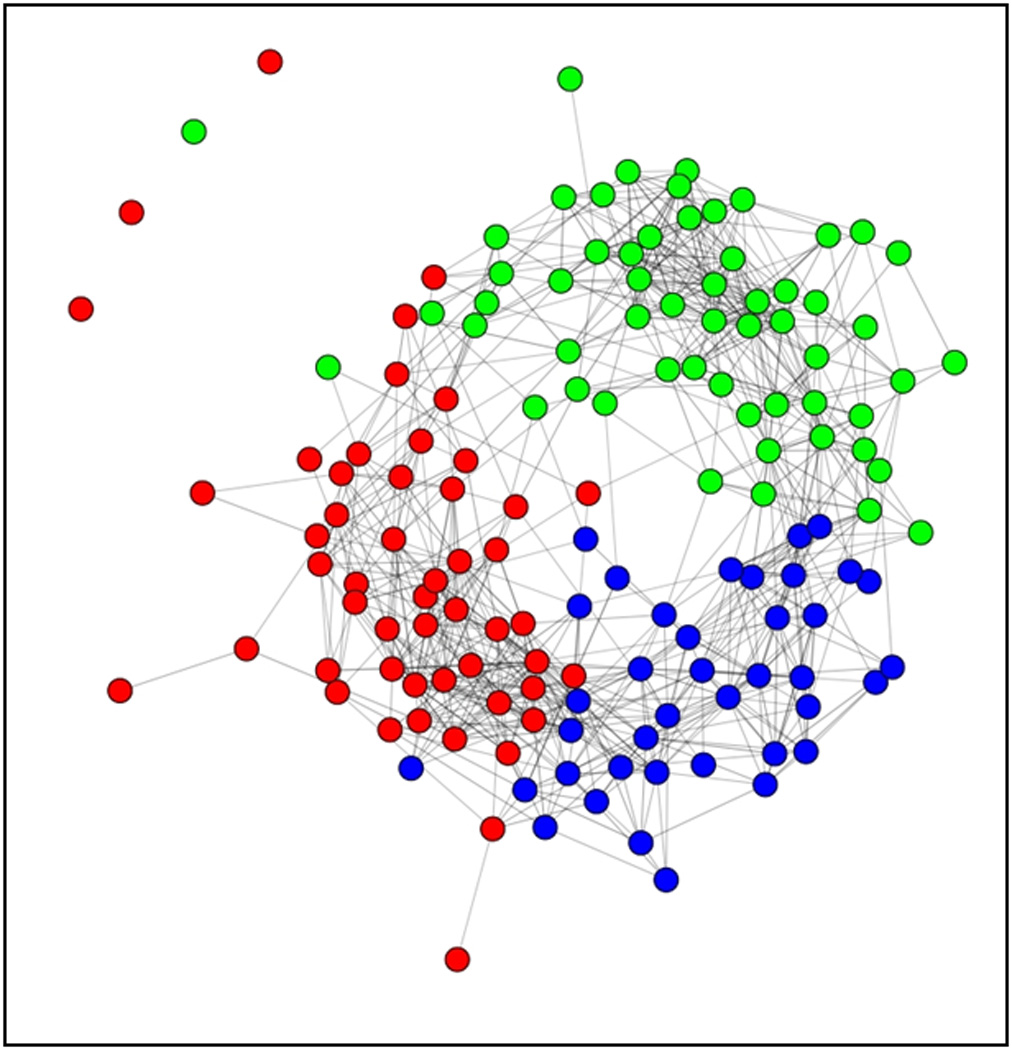
Graphical representation of the community detection results in the ADHD sample, which shows many strong correlations among individuals in the same temperament type and fewer between-type connections. Nodes represent individual’s in each temperament group (Blue: Mild, Red: Surgent, Green: Irritable) and connecting edges indicate correlations between individuals. (Note: Correlations are thresholded at .50 for purposes of visual representation; however, reported results are based on an unthresholded modularity algorithm as explained in Methods.)