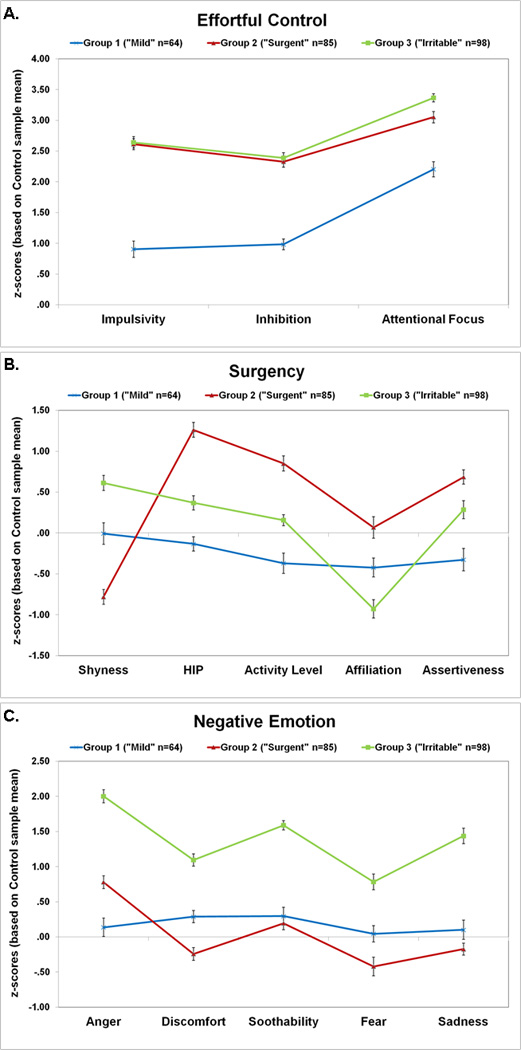
Figure 2. Temperament type profiles.

TMCQ scores for each of the three temperament types identified in the ADHD sample. Scores are shown as z-scores relative to the control sample mean (such that 0 on the Y axis is the mean of the typically-developing sample). Standard errors are shown. Scores were reversed for some scales as follows: for Inhibition high scores indicate less inhibitory control; for Attentional Focus, high scores mean poorer focus; for Shyness, high scores mean less shy; for Soothability, high scores indicate less soothabtility. Panel A) shows scores on temperament domains related to Cognitive Control; B) shows scores for Surgency domains; and C) shows scores for Negative Emotion Domains. Two scales that did not differentiate types (Openness and Perceptual Sensitivity) are not show, but scores for these scales are reported in eTable 2 in the Supplement.
