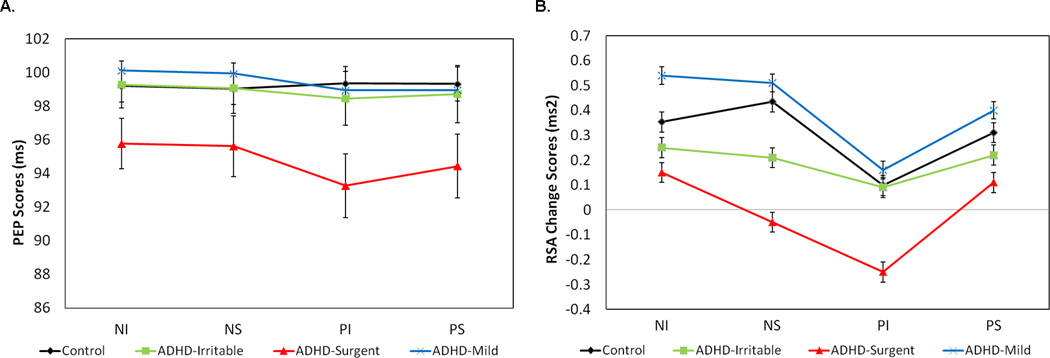
Figure 3. Cardiac physiological response.

A) Mean RSA change from baseline and B) raw PEP for each of the emotion task epochs: negative induction (NI), negative suppression (NS), positive induction (PI), and positive suppression (PS), shown by temperament type.
