
Figure 2.
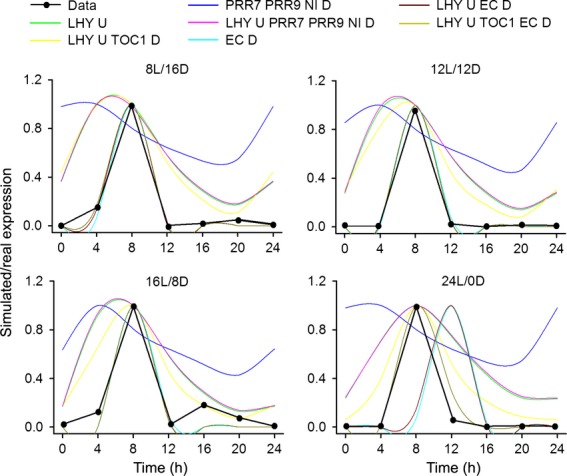
Simulation of the best model fit for each variant (coloured lines) against experimentally determined CBF3 expression (black line) in four indicated light regimes, either short days (8L/16D), 12 h light, 12 h dark (12L/12D), long days (16L/8D) or constant light 24L/0D. U indicated CBF3 transcription up-regulated by variable, D indicates CBF3 transcription down-regulated by variable.