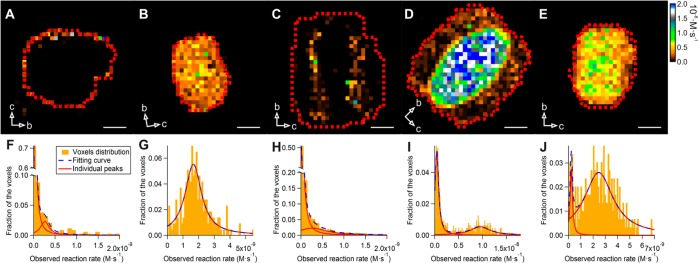
Figure 2.

Quantitative analysis of NASCA reactivity maps obtained for 500 × 500 × 800 nm3 voxels (XYZ). (A) SP-MOR crystal; (B) SD-MOR crystal; (C–E) MD-MOR crystals at different stages of dealumination. Red dashed line indicates the region used for histogram analysis; false color scale indicates observed reaction rate (from 0 to 2 × 10⁻⁸ M·s–1); crystal axes are indicated by arrows; scale bar: 3 μm. (F–J) Histograms of measured reactivity fitted with single, double, or triple Lorentzian curve as dashed blue line (for parameters, see Table S1): (F) SP-MOR crystal (presented in A); (G) SD-MOR crystal (presented in B); (H) MD-MOR crystal (presented in C); (I) MD-MOR crystal (presented in D); (J) MD-MOR crystal (presented in E).
