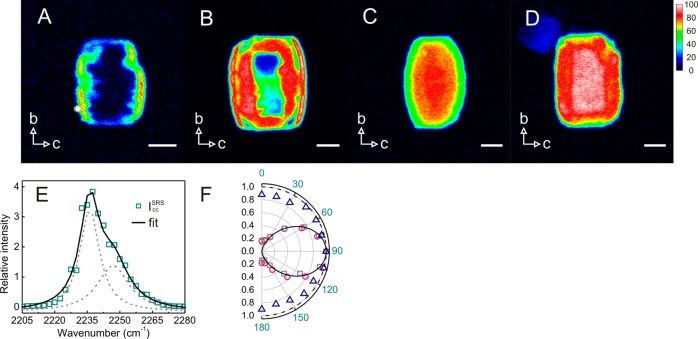
Figure 7.
SRS microspectroscopy and polarization dependence of PhCN adsorbed in SP-MOR. (A–D) Chemical mapping (2249 cm–1) of PhCN adsorbed in H-MORs revealing the accessibility of acid sites; gradual enhancement of acid site availability in MD-MOR from early (A), intermediate (B), and to late stages (C) of dealumination as well as SD-MOR (D). Images were recorded with lasers polarized along the crystallographic c-axis. False color scale indicates relative abundance of PhCN (from 0 to 100 au). Crystal axes are indicated by arrows. Scale bar: 3 μm. (E) SRS response in the C≡N stretch region for PhCN adsorbed in SD-MOR averaged over a single crystal; spectrum is fitted by a sum (solid line) of two Lorentzian curves (dashed lines). (F) Polar plots of 2237.5 (circle) and 2249 cm–1 (squares) vibrations with respect to crystallographic b-axis recorded in the bc plane of the crystal; a sin2 θ function (solid line) is shown for comparison. Polar plot of 2237.5 cm–1 with respect to crystallographic b-axis recorded in the ab plane of the crystal (triangle); a circle with a radius of 1 (solid line) is shown for comparison.

