Figure 4.

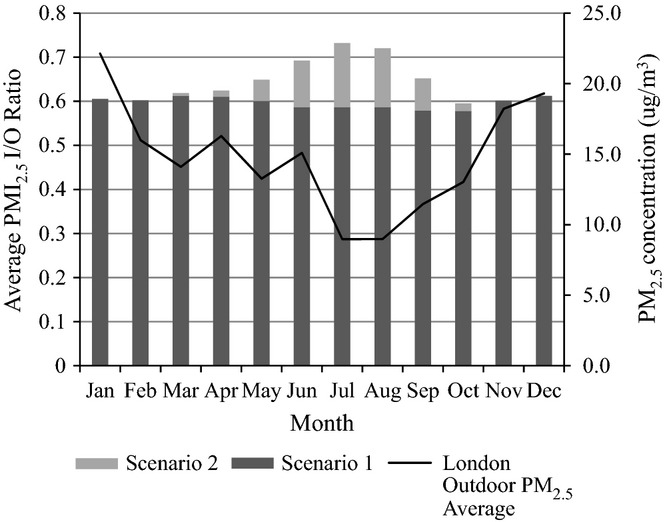
Average monthly PM2.5 I/O ratios for the bungalow living room under scenarios 1 and 2 (modeled with trickle vents), and monthly variation in London background PM2.5 levels (London Air, 2014)

Average monthly PM2.5 I/O ratios for the bungalow living room under scenarios 1 and 2 (modeled with trickle vents), and monthly variation in London background PM2.5 levels (London Air, 2014)