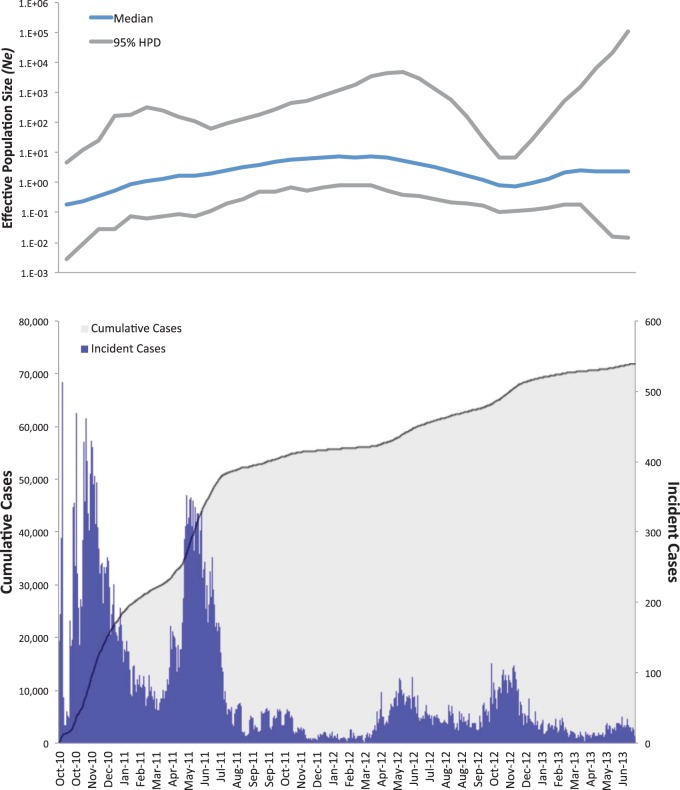
FIG 3 .
Effective population size (Ne) estimates from Bayesian phylogenetic analysis and epidemiological case counts for the coinciding period. The blue line and the gray upper and lower bounds represent, respectively, median and 95% high posterior density (95% HPD) interval estimates of Ne over time. The bottom panel shows the number of cumulative (shaded area) and incident (histogram) cholera cases from October 2010 to June 2013.

