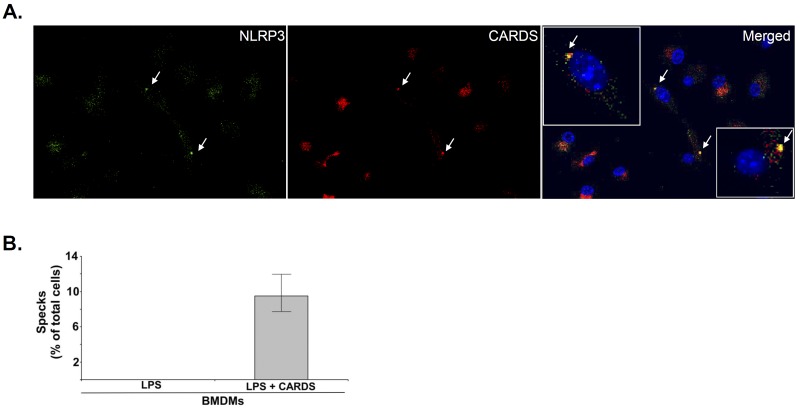
FIG 3 .
Colocalization of CARDS toxin with NLRP3. (A) Coimmunofluorescence analysis of CARDS toxin (red) and NLRP3 (green) in mouse BMDMs. WT BMDMs were treated with LPS (100 ng/ml) for 4 h, followed by mCherry-tagged CARDS toxin (70 pmol) for 24 h. Cells were stained with mouse monoclonal antibody reactive against NLRP3 (1:300) and counterstained with goat anti-mouse IgG conjugated with FITC (green). Nuclei were stained with DAPI (blue). The merged image (yellow) shows colocalization of CARDS toxin with the NLRP3 inflammasome speck (white arrows). The boxed inserts in the merged panel show magnified views of speck-containing cells demonstrating both colocalization and distinct patterns of CARDS toxin and NLRP3 staining. (B) The number of specks in CARDS toxin-treated WT BMDMs was quantified and expressed as the percentage of specks per cell number as described in Materials and Methods. The percentage of cells with specks relative to the total number of cells is shown.

