
Figure 4.
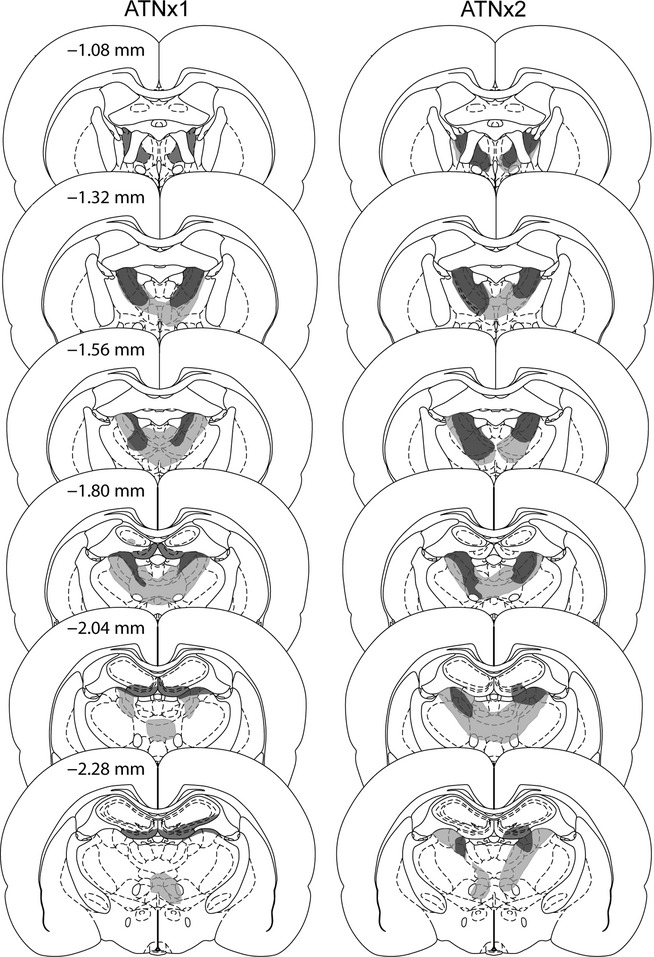
The minimum (dark grey) and maximum (light grey) extent of the lesions for the ATNx1 and ATNx2 groups. The numbers refer to the approximate distance of the section in mm caudal to bregma. The sections are modified from Paxinos & Watson (2005). It should be noted that other rats in the ATNx1 and the ATNx2 groups had less unintended hippocampal damage than that depicted.