
Figure 6.
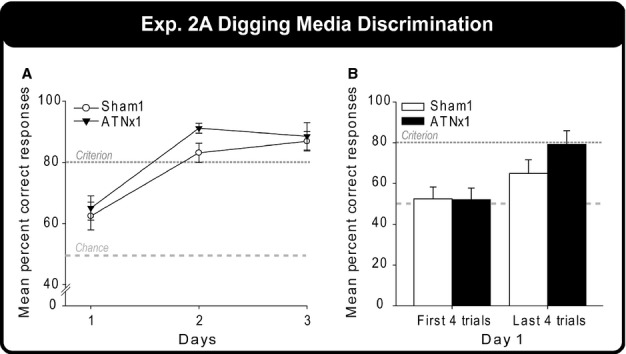
Digging media discrimination task. The graph shows the mean percentage correct responses of the Sham1 and ATNx1 groups for each of the three test days. The light grey long-dashed line indicates chance (50%) and the dark grey short-dashed line indicates criterion (80%). The graphs show the mean ± SEM scores.