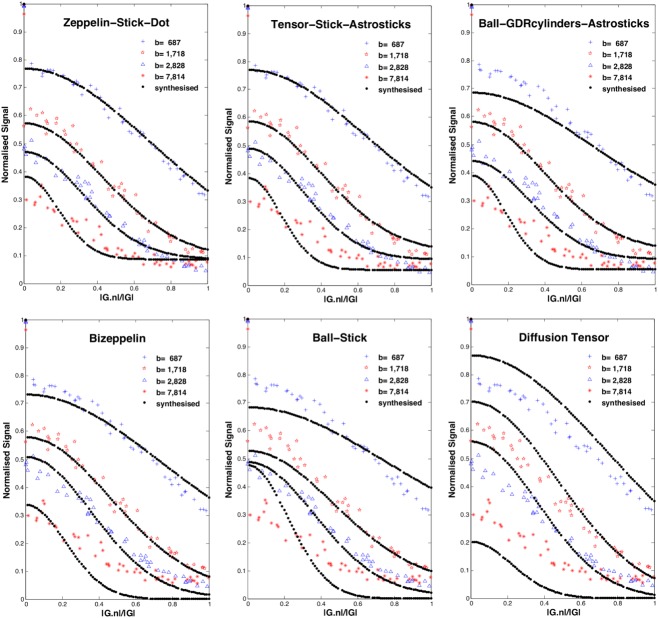
Figure 3.
Synthesised signal, shown as dotted line, using the best parameter estimates from six representative models. This is superimposed on raw data, marked with red/blue colors; for clarity, we only show four shells across the sampled range of b-values. [Color figure can be viewed in the online issue, which is available at wileyonlinelibrary.com.]

