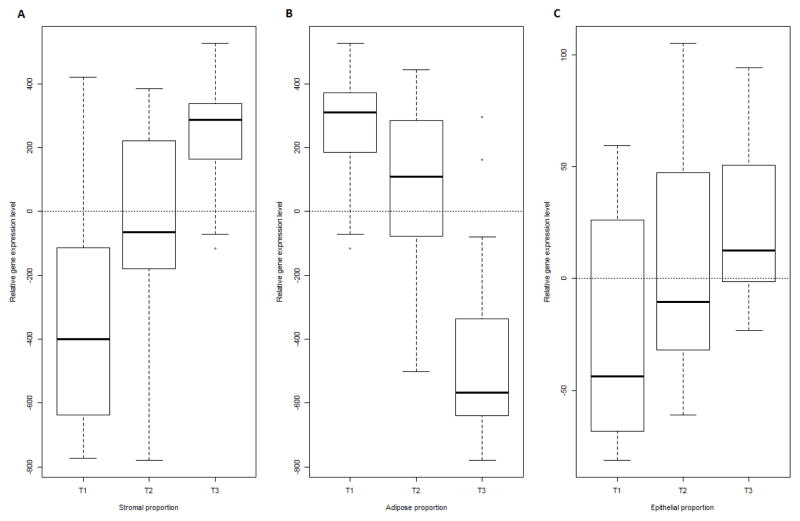
Figure 2. A–C. The average gene expression level of epithelial and stromal composition signatures across breast tissue composition groups in test dataset (n=50).
The association of relative expression of epithelial and stromal composition signatures with breast tissue composition was validated in a test set sample (n=50). The log2(R/G) expression for each gene of each composition signature was multiplied by corresponding direction index (1 for up-regulated genes, and −1 for down-regulated gene), and results were summed across all genes as relative gene expression level. This relative gene expression level was evaluated for association with tissue composition by tertiles (cutoff points: epithelial proportion, 7.20% and 16.05%; stromal proportion, 10.78% and 34.31%; adipose proportion, 47.11% and 79.62%). A and C. The average gene expression level of the stromal and epithelial composition signatures increased with actual stromal and epithelial proportion (age-adjusted p-value for trend <0.001). B. The expression level of the stromal signature decreased with actual adipose proportion (age-adjusted p-value for trend <0.001).

