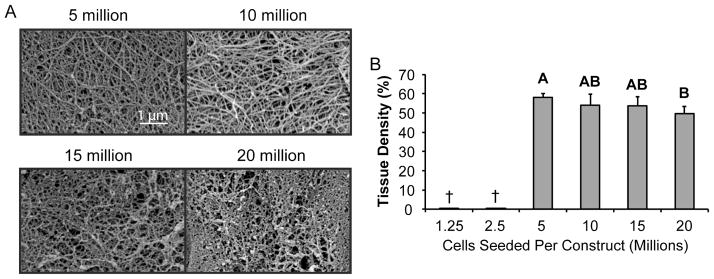
Figure 7. Tissue density is greatest in constructs seeded with 5 million cells and decreases with higher seeding density.

When imaged with SEM, constructs seeded with 5 or 10 million cells exhibited a denser tissue with clearly defined fibers. In comparison, constructs seeded with 15 or 20 million cells displayed a less dense extracellular matrix with a less prominent collagen network. When quantified, tissue density was greatest in constructs seeded with 5 million cells, and decreased afterwards, becoming significantly less in constructs seeded at the historical density of 20 million cells per construct. Groups lacking a letter in common are significantly different (p < 0.05). Constructs seeded with fewer than 5 million cells were not assessed († = not imaged with SEM).
