
Figure 1. Time course of SP and LPS-induced TNF secretion, mRNA expression and light microscopy of LAD2 cells.
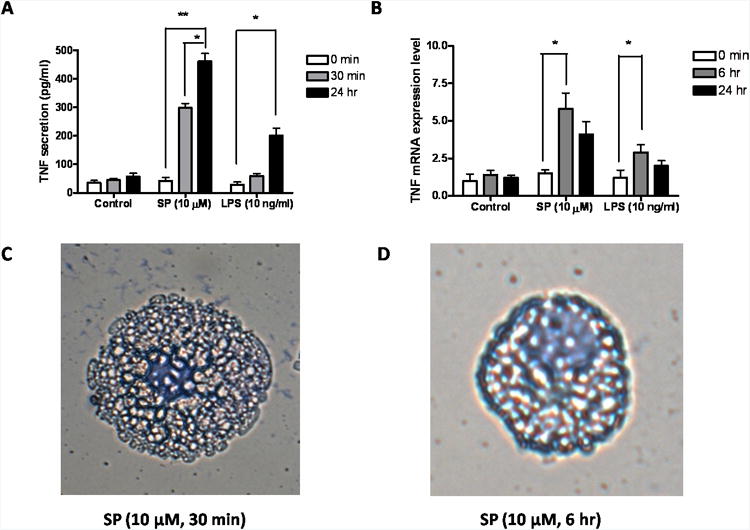
LAD2 cells were treated with SP (10 μM) or LPS (10 ng/ml) for the time indicated. (A) TNF release was measured by ELISA (R&D System) in the supernatant fluid (n=3; * p<0.05, **p<0.01). (B) TNF mRNA expression was measured by Real Time PCR (n=3;p, *P<0.05). (C, D) LAD2 cells were stained with Tuidine blue and were observed under light microscopy. LAD2 cells were treated with SP (10 μM) for (C) 30 min and (D) 24 hr. (Scale bars = 5 μm). (E) Beta-hex release was measured (n=3; * P<0.05, **P<0.01). (F) TNF release was measured from cells treated with SP with or without Actinomycin D pre-incubation (15 μg/ml for 60 min) (n=3; * p<0.05, **p<0.01).