
Figure 4. Degranulation, but not de novo TNF release, is associated with mitochondrial translocation.
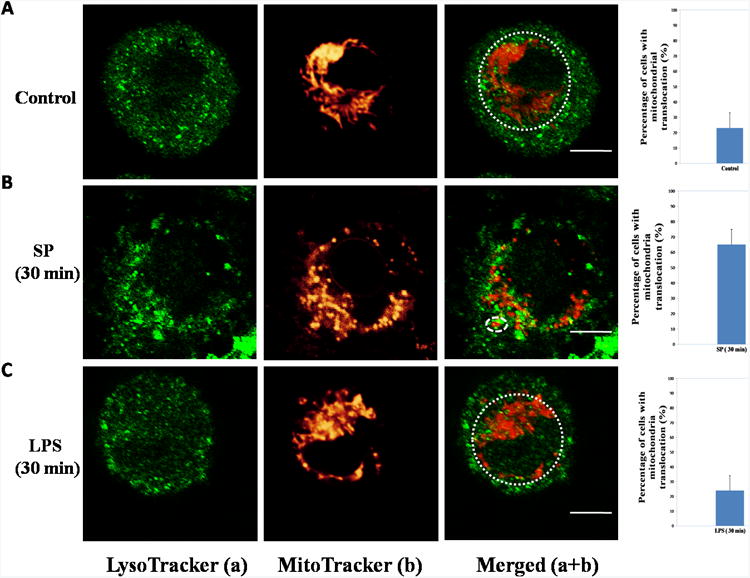
LAD2 cells were stained with MitoTracker deep red probe (20 nM) for 20 min and LysoTracker DND green probe (50 nM) for 30 min. The cells were harvested in glass bottom culture dishes and observed under the Leica TCS SP2 Confocal microscope. The left panels depict granules in green and the middle panels represent mitochondrial fluorescence shown in red. The right panels represent images merged from the two previous panels. The white dashed circles on the right panels outline the “mitochondrial pool”. The graphs shown at the far right represent percentages of mast cells with mitochondrial translocation obtained from 100 randomly selected cells. (A) Control groups. (B) SP (10 μM, 30 min). (C) LPS (10 ng/ml, 30 min). Each experiment was repeated three times and was evaluated by three independent operators. Scale bars = 5 μm.