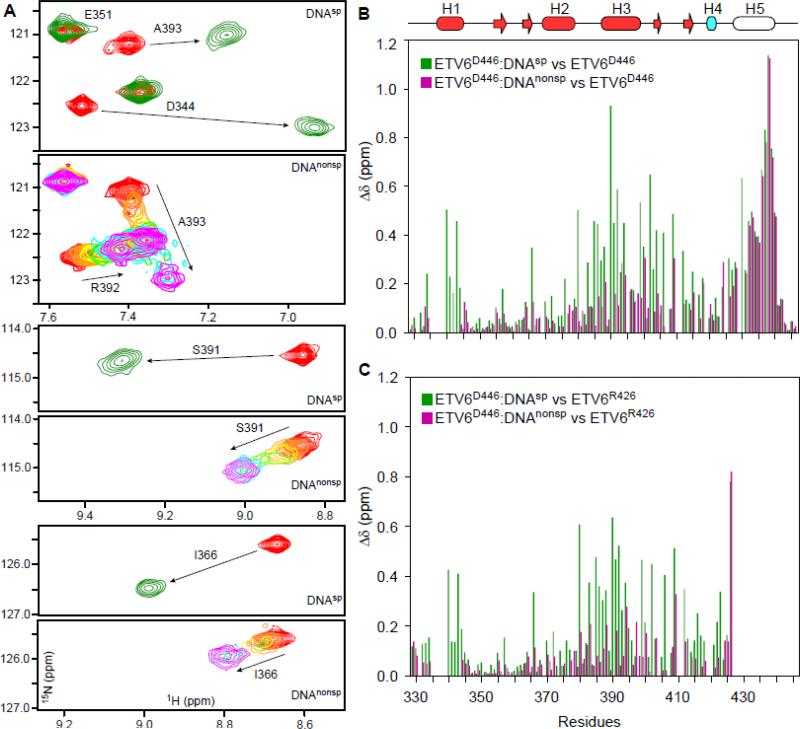
Fig. 1. NMR monitored titrations of ETV6 fragments with DNA.
(A) Overlaid regions of the 15N-HSQC spectra of ETV6D446 recorded in the absence (red) or presence of a 1.1 molar ratio of DNAsp (green). High affinity binding occurs the slow exchange regime and only signals from the free or bound protein are detected at intermediate molar ratios (not shown). Also shown are the same spectral regions when ETV6D446 is titrated with DNAnonsp in molar ratios of 0 (red), 0.1, 0.25, 0.5, 0.75, 1, 2, and 3 (magenta). With weaker affinity, binding occurs in the fast exchange regime and signals progressively change from the chemical shift of the free to the DNA-bound state. Some broadening also occurs at intermediate saturation. See Supplemental Figure S1 for the full spectra. (B) Amide CSP's (Δδ = {(ΔδH2 + (0.154ΔδN)2}1/2) for ETV6D446–DNAsp (green) and ETV6D446–DNAnonsp (magenta) with respect to free ETV6D446. The unfolding of helix H5 leads to large CSP's of similar magnitude for residues 430 - 440 in both complexes. In contrast, the CSP's for the ETS domain result from the displacement of helix H5 and the binding of DNA. In (C), the effects of helix H5 unfolding are removed by calculating CSP's relative to unbound ETV6R426, which lacks this helix. Note that these CSP's were calculated using the chemical shifts of ETV6D446 in the presence of a 1.1-fold molar excess of DNAsp and 3-fold molar excess of DNAnonsp, and thus correspond to 99% and 98% saturation, respectively, based on their respective KD values and binding site sizes. The secondary structure (helix, cylinder; strand, arrow) is displayed as cartoon on top with the core ETS domain in red and helix H4 of the CID in cyan. Helix H5, which is unfolded in both complexes, is not colored.

