Figure 1.

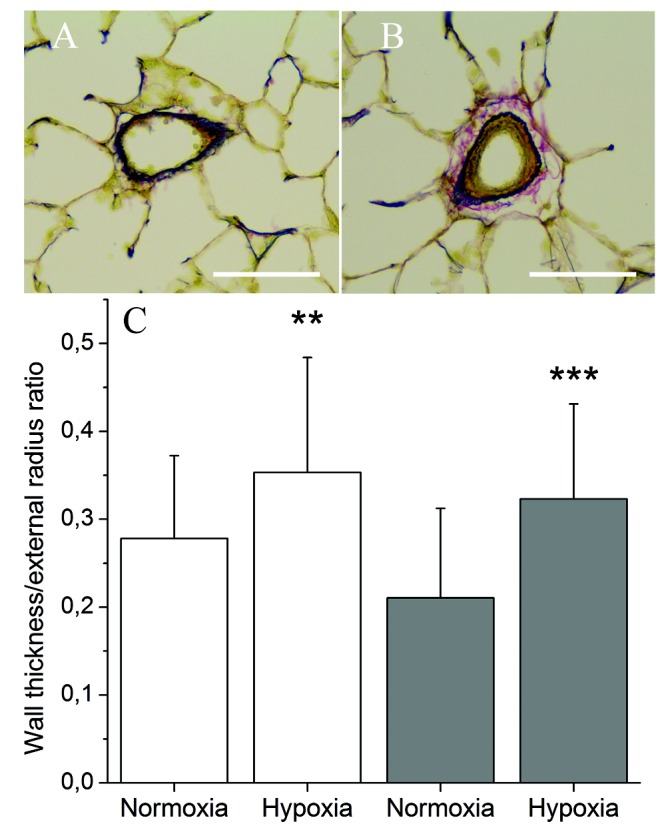
Morphometric analysis of pulmonary blood vessels. A, B, Representative paraffin-embedded lung sections stained using Miller’s technique from a normoxic rat (A) and a hypoxic rat (B). Elastic fibers are colored in dark blue, cytoplasm in yellow, and collagen in red. Scale bars: 50 μm. C, Analysis of the ratio between vessel lumen and external radii. Data represent mean + SD from blood vessels with a diameter of 60–100 μm (open bars) and vessels with a diameter of 100–200 μm (filled bars). Five normoxic and 5 hypoxic lungs were used, and 7–12 blood vessels were analyzed from each lung in each diameter category. Double asterisks indicate P = 0.002 and triple asterisks P = 0.0001 (one-way ANOVA).
