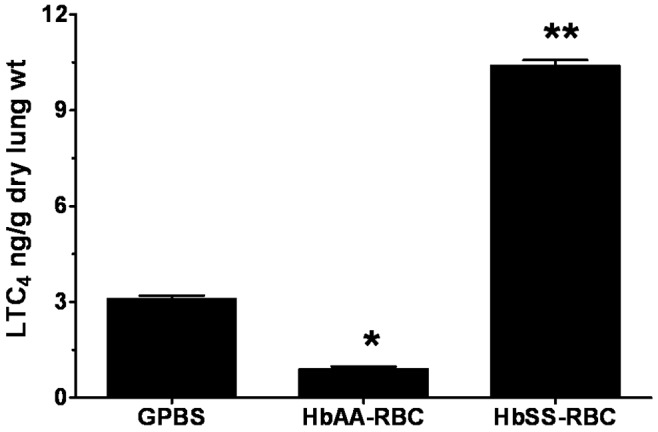
Figure 2.

Profile of leukotriene C4 (LTC4) produced by isolated rat lungs perfused with buffer alone or with erythrocytes, with metabolites measured at 15 minutes of perfusion. Three separate groups of lungs were perfused with buffer (GPBS; n = 6), normal erythrocytes (HbAA-RBC; n = 6), or sickle cell erythrocytes (HbSS-RBC; n = 12). Perfusates were collected as described in “Methods,” and the LTC4 was extracted, purified by high-pressure liquid chromatography, and measured by enzyme-linked immunosorbent assay. Data are means + SEM. A single asterisk indicates significant (P < 0.05) difference from LTC4 production in GPBS control; double asterisks indicate significant (P < 0.05) difference from both GPBS controls and the HbAA-RBC group. GPBS: phosphate-buffered saline containing 131 mM NaCl, 5.1 mM Na2HPO4, 1.5 mM KH2PO4, 1% bovine serum albumin, and 8.3 mM glucose.
