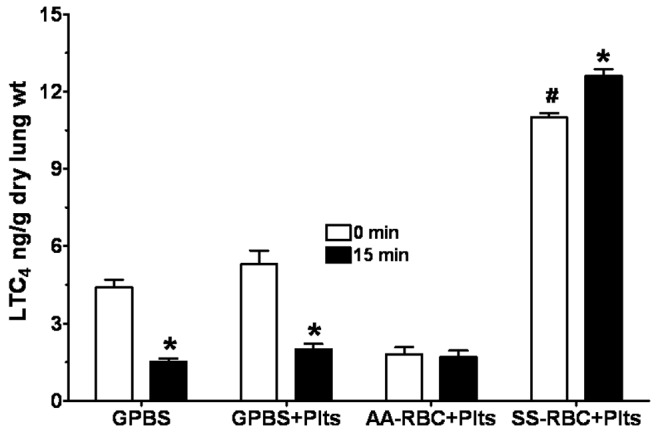
Figure 3.

Profile of leukotriene C4 (LTC4) produced by isolated rat lungs perfused with GPBS or with HbAA (AA) or HbSS (SS) erythrocytes plus autologous platelets (Plts), measured at 0 and 15 minutes of perfusion. See Figure 2 for experimental details and other abbreviations. Data are means + SEM. An asterisk indicates significant (P < 0.05) difference from LTC4 production in the same group at 0 minutes. A pound sign (#) indicates significant (P < 0.05) difference from LTC4 production in all other groups.
