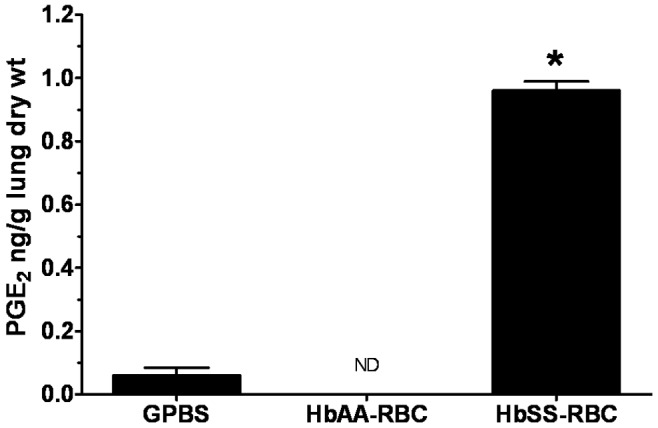
Figure 5.

Profile of prostaglandin E2 (PGE2) produced by isolated rat lungs perfused with buffer alone or with erythrocytes, with metabolites measured at 15 minutes of perfusion. See Figure 2 for experimental details and abbreviations. Data are means + SEM. ND: none detected. An asterisk indicates significant (P < 0.05) difference from PGE2 production in GPBS control.
