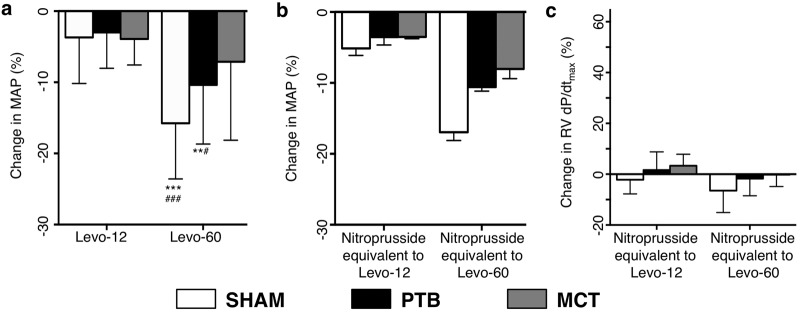
Figure 4.

a, Changes in mean arterial blood pressure (MAP) after Levo-12 and Levo-60 administration compared with placebo. b, Hemodynamic effects of nitroprusside. Shown are changes in MAP compared with placebo. Compare this to the decrease in MAP seen in a. c, Changes in right ventricular (RV) dP/dtmax caused by the nitroprusside-induced decrease in MAP. All of these are nonsignificant. Compare this to Figure 3b. Two asterisks indicate P < 0.01 versus placebo, three asterisks indicate P < 0.001 versus placebo, one pound sign indicates P < 0.05 versus Levo-12, and three pound signs indicate P < 0.001 versus Levo-12. Data are mean ± SEM. PTB: pulmonary trunk banding; MCT: monocrotaline.
