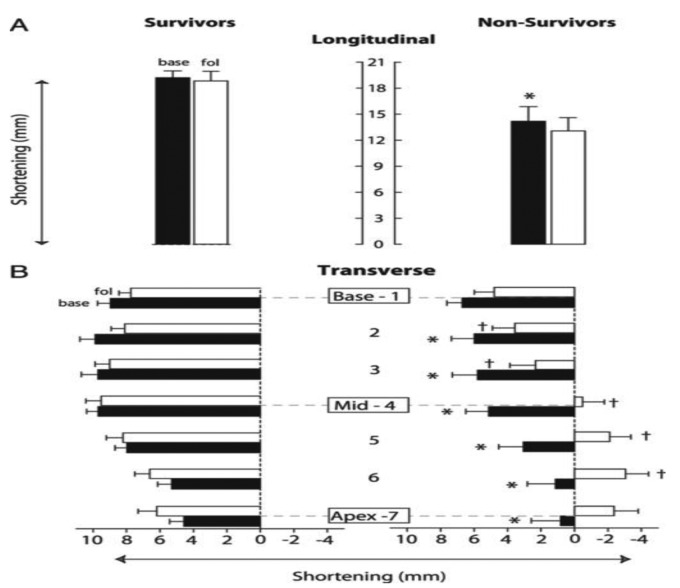
Figure 4.
Dynamic changes in right ventricular (RV) transverse shortening and its association with pulmonary hypertension (PH) survival compared with RV longitudinal shortening. RV longitudinal and transverse shortening at baseline and follow-up are shown, indicating the average RV longitudinal (A) and transverse (B) shortening in survivors and nonsurvivors for baseline (black bars) and follow-up (white bars). A, Longitudinal shortening in nonsurvivors is significantly (P < .05, indicated by an asterisk) decreased at baseline compared with that in survivors, whereas no significant change during follow-up is seen in either group. B, Transverse shortening in nonsurvivors is significantly (P < .05, indicated by asterisks) decreased for levels 2–7 at baseline compared with that in survivors. During follow-up, RV transverse shortening for levels 2–6 further decreases significantly (P < .05, indicated by daggers) from baseline and even shows lengthening at the midventricular to apical level, whereas it did not decrease in survivors. Data are mean ± SEM. Base: baseline; fol: follow-up. Adapted with permission from Mauritz et al.27

