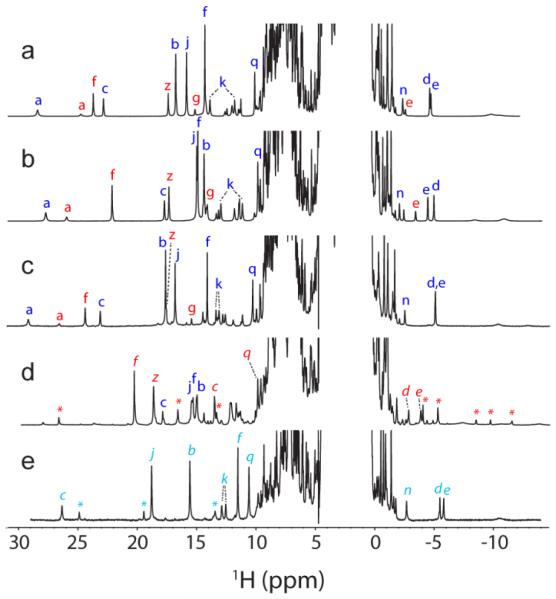
Fig. 3.
Comparison of WT, T111H, and L75H cyanomet CtrHb 1H NMR spectra. (a–c). Spectra collected prior to DT treatment. The major and minor heme orientational isomers are indicated with blue and red letters, respectively. (a) Wild-type cyanomet CtrHb (72% major, 28% minor). (b) T111H cyanomet CtrHb (67% major, 33% minor). (c) L75H cyanomet CtrHb (62% major, 38% minor). (d–e). Spectra collected after DT treatment and reoxidation. (d) T111H cyanomet CtrHb-A4 product mixture. The predominant form (~60%, H111 reaction with the 4-vinyl group) is marked with red italics. The spectrum also contains 25% of the unreacted major isomer (starting material, b, blue letters), and a small amount of a third species (marked with red *). (e) L75H cyanomet CtrHb-B product (~90%, H75 reaction with the 4-vinyl group). A second product species (10%, likely H75 reaction with the 2-vinyl group) is marked with cyan *. Peak labeling: a, Tyr20 OηH; b, heme 1-CH3; c, heme 2-vinyl Hα; d, e, heme 2-vinyl Hβcis, Hβtrans; f, heme 3-CH3; g, heme 4-vinyl Hα; j, heme 5-CH3; k, heme 6-propionate Hα, Hα’; n, heme 7-propionate Hβ; q,Tyr20 CεHs; z, heme 8-CH3.

