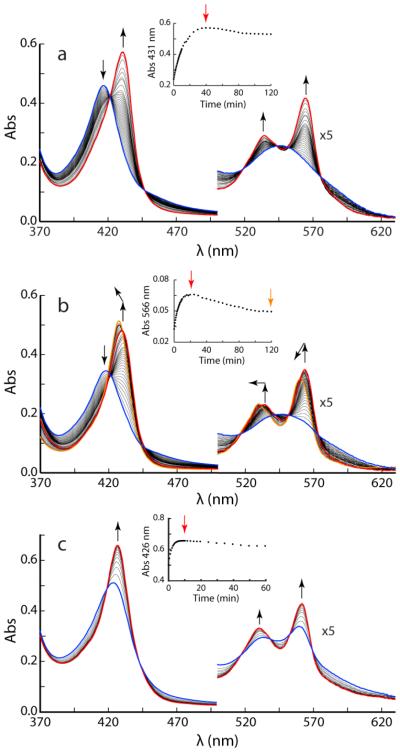
Fig. 5.
DT-mediated reduction of cyanomet CtrHbs monitored by UV-vis spectrophotometry. In each reaction, spectra were taken every 30 s for the first 10 min, every 2 min for the following 20 min, and every 5 min for the remaining 1.5 h. (a) Reduction of cyanomet WT CtrHb. The reduction progresses over 40 min from the blue spectrum to the red spectrum. Inset: kinetic trace at 431 nm; the decrease in signal after 40 min (time marked by red vertical arrow) is attributed to damage by DT. (b) Reduction of cyanomet T111H CtrHb. The initial response is similar to WT (blue to red spectrum) but occurs within 25 min. An additional blue shift of the spectrum is distinguished after this first phase (red to orange spectrum). Inset: kinetic trace at 566 nm to show the biphasic nature of the spectral evolution. The red and orange arrows mark the time of the red and orange spectra. (c) Reduction of cyanomet L75H CtrHb. The Soret band shifts to ~426 nm within the ~10-s manual mixing dead time. The reduction progresses over 10 min from the blue spectrum to the red spectrum, which is distinct from ferrous L75H CtrHb and corresponds to crosslinked L75H. Inset: kinetic trace at 426 nm, the decrease in signal after 10 min (time marked by red vertical arrow) is attributed to damage by DT. Note that only the first 60 min are shown.

