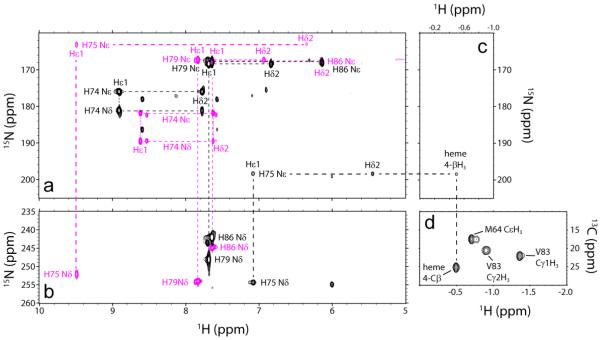
Fig. 6.
Histidine assignment in cyanomet L75H CtrHb and product CtrHb-B by NMR spectroscopy (pH 7.1–7.2, 298 K). (a) Overlay of 1H-15N lr-HMQC data (15N upfield region). Signals from all histidine residues (except proximal H68) were detected. Reactant (magenta) and product (black) L75H histidine spin systems are connected with dashed lines. (b) Overlay of 1H-15N lr-HMQC data (15N downfield region). Colors are as in (a). Note that the similarity of the H86, H74, and H79 imidazole signals (a, b) in CtrHb and CtrHb-B. Conversely, H75 Nε2, along with Hε1 and Hδ2, undergoes significant changes. (c) 1H-15N lr-HMQC data (1H far-upfield region). In L75H cyanomet CtrHb-B, H75 Nε2 has a cross peak at −0.49 ppm, indicative of histidine N-alkylation. (d) Portion of a natural abundance 1H-13C HMQC spectrum collected on L75H cyanomet CtrHb-B. The coupled 1H-13C HSQC spectrum (Supporting Information Fig. S19) confirms that the resolved peak at a proton shift of −0.49 ppm is a methyl group.

