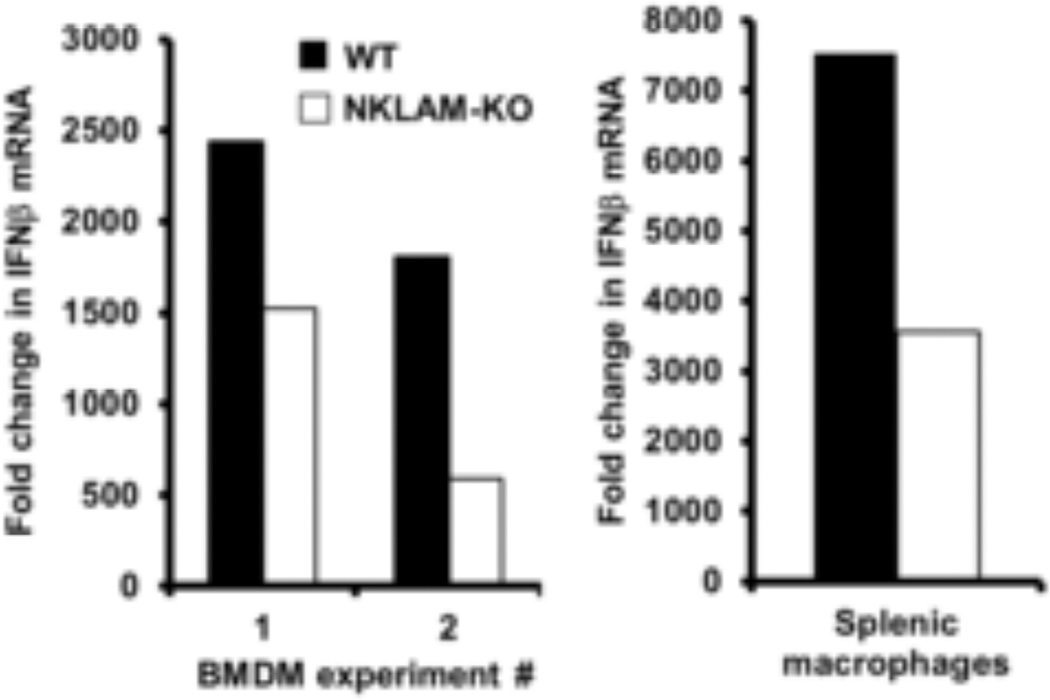
Figure 3. Interferon beta mRNA expression in WT and NKLAM-KO splenic macrophages and BMDM following LPS stimulation.
WT (black column) and NKLAM-KO (white column) BMDM and splenic macrophages were treated with 100 ng/ml LPS for 2 h. Total RNA was isolated and IFNβ mRNA expression was determined by quantitative real-time PCR. Three individual experiments are presented. Graphs depict the fold change (2−ΔΔCt) in IFNβ mRNA levels at 2 h LPS.

