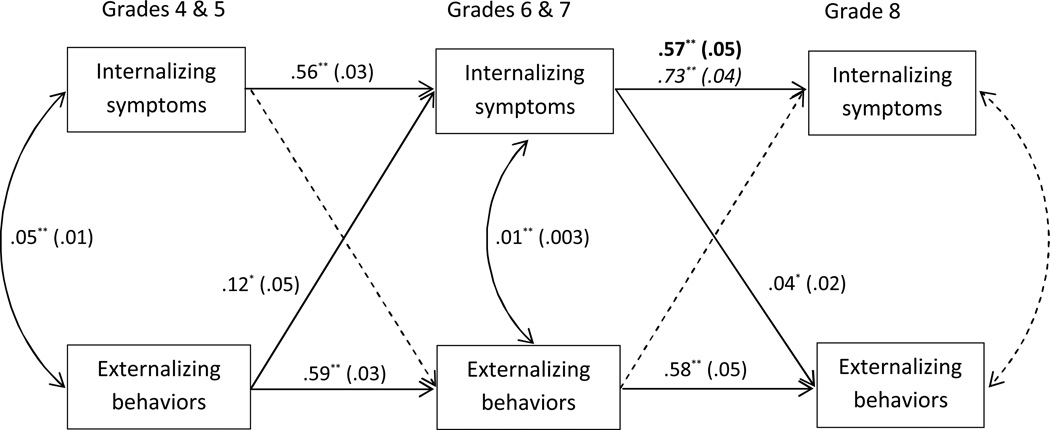
Figure 1. Path model of associations between externalizing behaviors and internalizing symptoms.
Paths from covariates of average family income and race/ethnicity are not shown. Solid lines represent statistically significant (p < .05) paths. Dashed lines were estimated but were not statistically significant. Numbers on significant paths are unstandardized estimates with standard errors in parentheses. For the path from internalizing symptoms at Grades 6 & 7 to internalizing symptoms at Grade 8, the estimates for boys are in bold and the estimates for girls are in italics. Fit statistics are χ2(24, N = 981) = 79.50, p < .01, CFI =.97, and RMSEA = .06. * p < .05, ** p < .01

