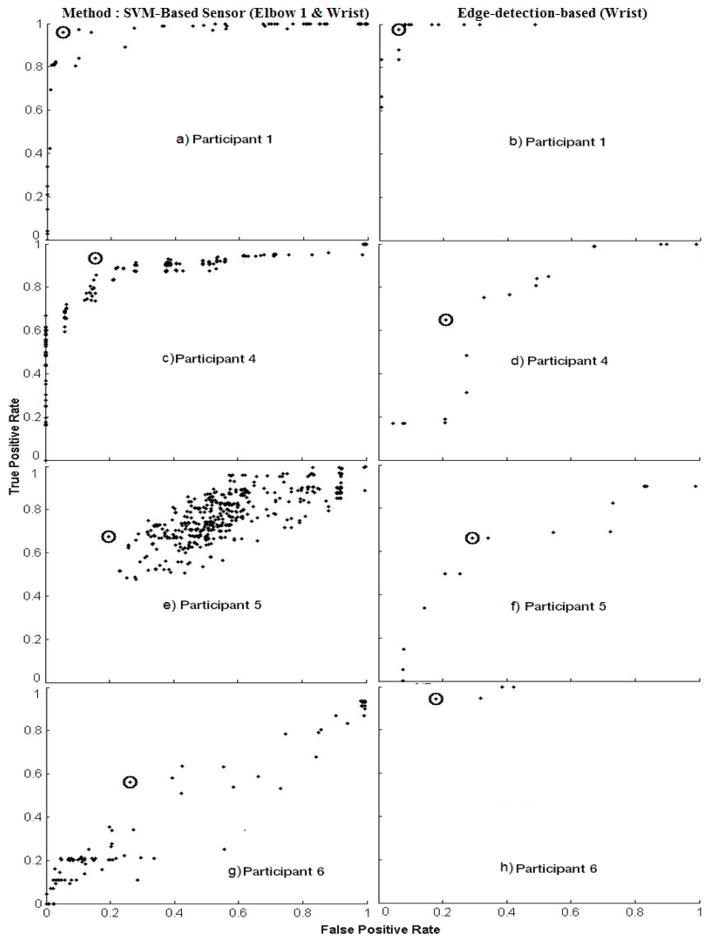
Figure 3.
Receiver Operator Characteristic (ROC) Curves for each participant with SVM-based (left column) and Edge-detection based methods (right column). Every data point represents a different configuration feature set. The circled points indicate the configurations that produced the best results.

