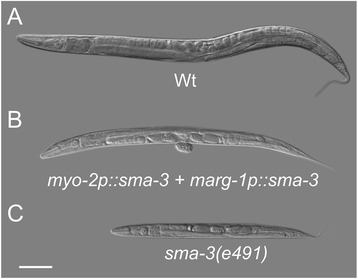
Figure 4.

Nomarski differential interference contrast (DIC) images of sodium azide anesthetized 96 ± 1 hrs AEL (A) Wt (N2); (B) sma-3(e491) mutant with pharyngeally-expressed sma-3 minigene (sma-3(e491); ivEx163[myo-2p::sma-3 marg-1p::sma-3 elt-2p::tdTomato::His2B]) ; (C) sma-3(e491) mutant non-transgenic sibling of B. Scale bar is 100 μm.
