
Figure 3.
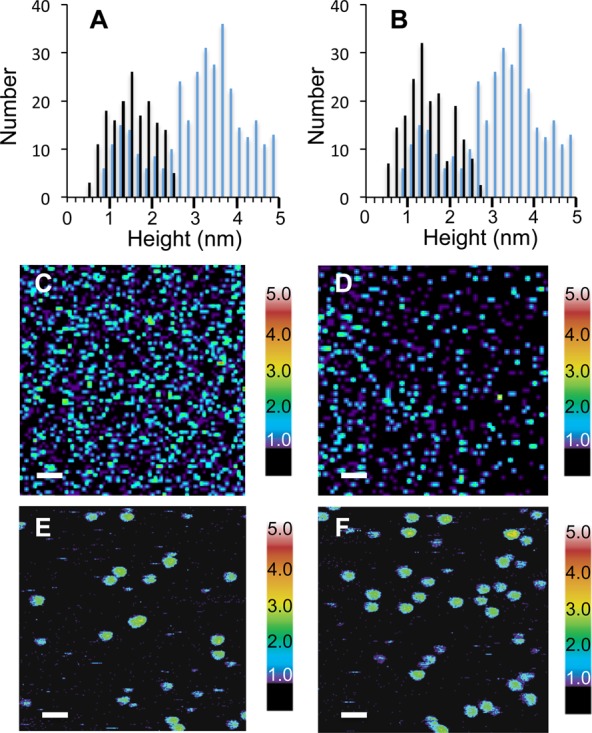
Capping of oligomer heights by inhibitors. (A) Capping of Aβ42 oligomer heights by curcumin. Histograms are shown of oligomer heights obtained from AFM images after 6 h of incubation of Aβ42 either with (black bars) or without (blue bars) curcumin. The temperature was maintained at 37 °C and the molar ratio of curcumin-to-Aβ42 was 1:1. (B) Capping of Aβ42 oligomer heights by resveratrol. Histograms are shown of oligomer heights after 6 h of incubation of Aβ42 either with (black bars) or without (blue bars) resveratrol at 37 °C and a molar ratio of resveratrol-to-Aβ42 of 1:1. (C–F) AFM images of Aβ42 with curcumin (C,E) or resveratrol (D,F) after incubation for 6 h. Scale bars are 100 nm in (C,D) and 50 nm in (E,F).