
Figure 4.
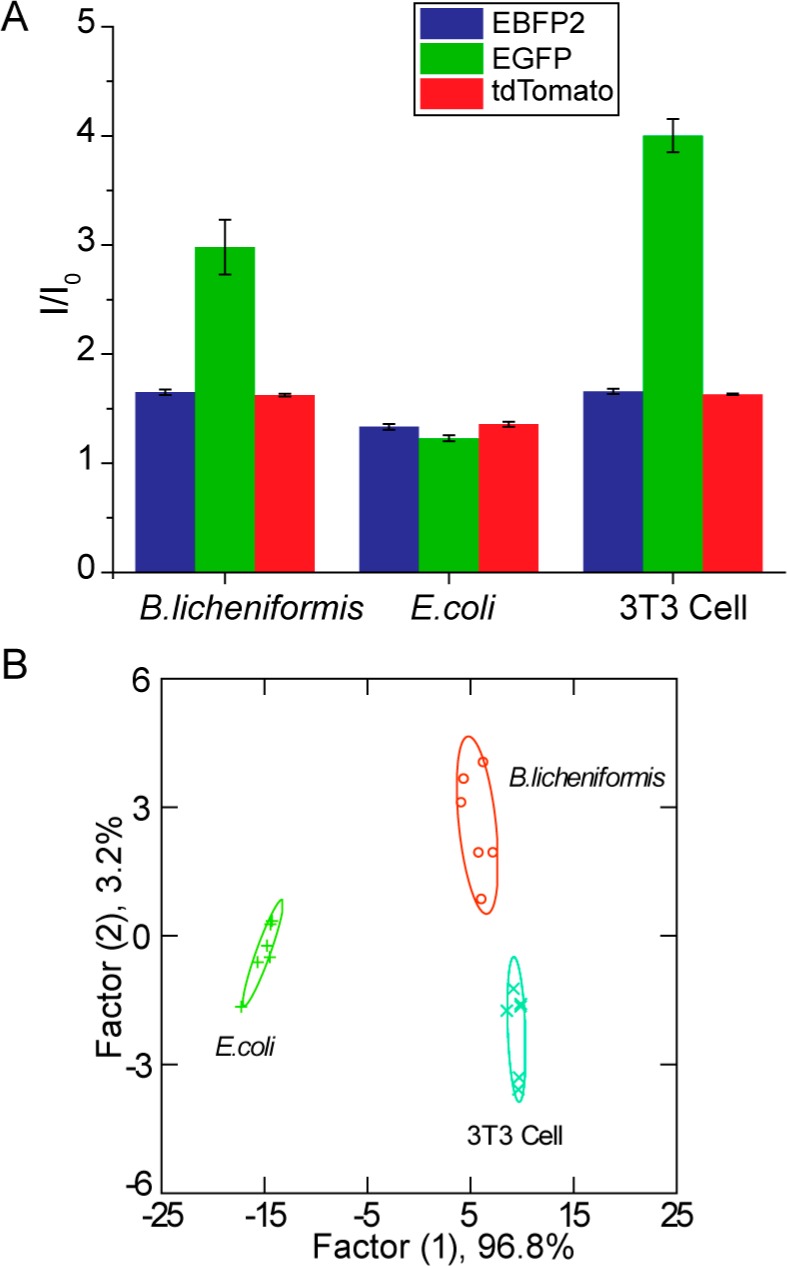
Detection and identification of biofilms grown on 3T3 fibroblast cells. (A) Triple-channel fluorescence response patterns in the presence of biofilms grown on fibroblast cells and 3T3 fibroblast cells alone. I0 is the fluorescence intensity in the absence of biofilms or 3T3 cells. Each value is an average of six data points, and the error bars are standard deviations. (B) LDA canonical score plot of the fluorescence response patterns.