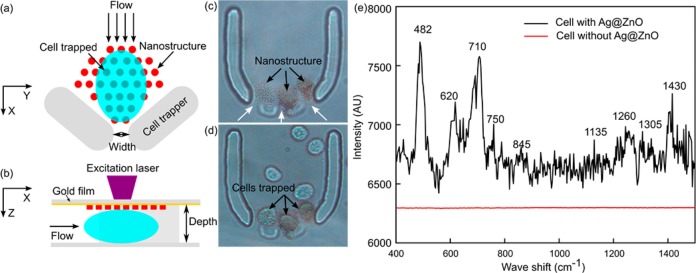
Figure 7.

SERS fingerprinting of trapped single cells. Schematic demonstration of the cell-trapping device and the optothermal SERS substrate preparation concept in (a) X–Y plane and (b) X–Z plane; (c) Ag@ZnO nanorods were fabricated within the cell-trapping device; (d) single Hela cell were trapped at individual outlets of the horseshoe structure; (e) SERS peaks of cell surface with Ag@ZnO nanostructure (black line) and without Ag@ZnO nanostructures (red line).
