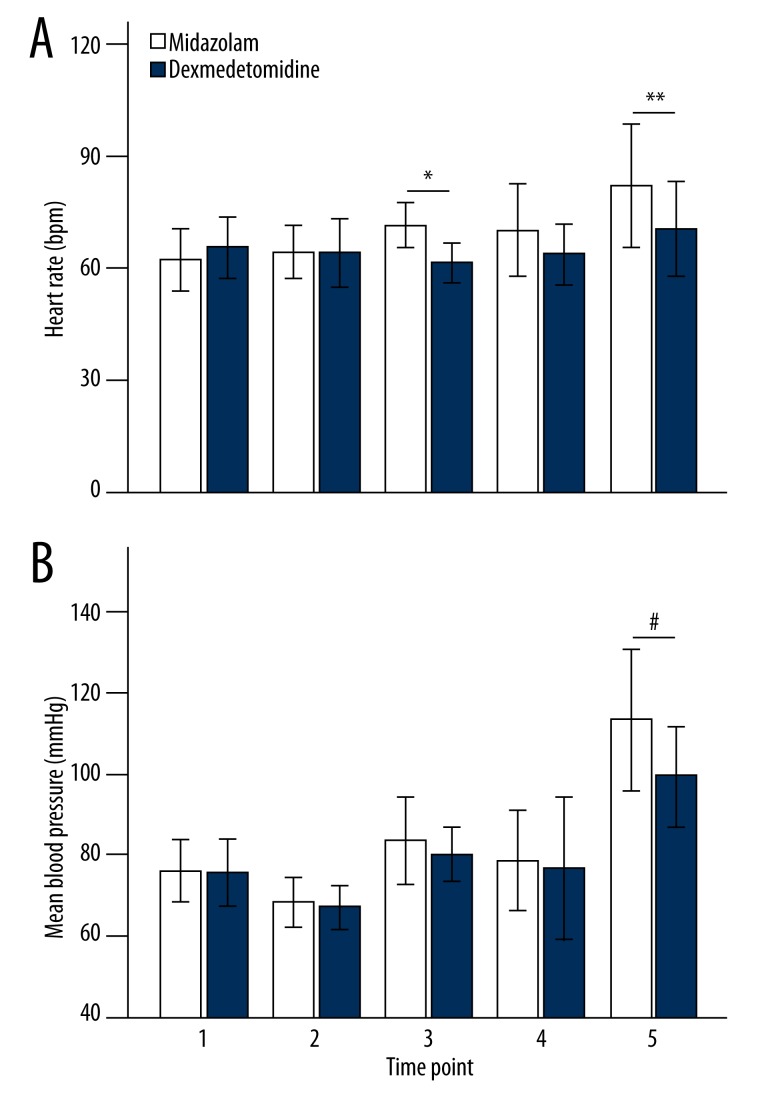
Figure 2.
Hemodynamic responses at different time points in patients receiving intramuscular midazolam 0.02 mg/kg or dexmedetomidine 1 μg·kg−1. (A) Heart rate response. (B) Mean arterial pressure response. Time point 1 represents baseline, 2 at pre-induction, 3 after induction, 4 at eye opening, and 5 after extubation. The bar represents mean (SD). * P=0.003; ** P=0.031; # P=0.035.

