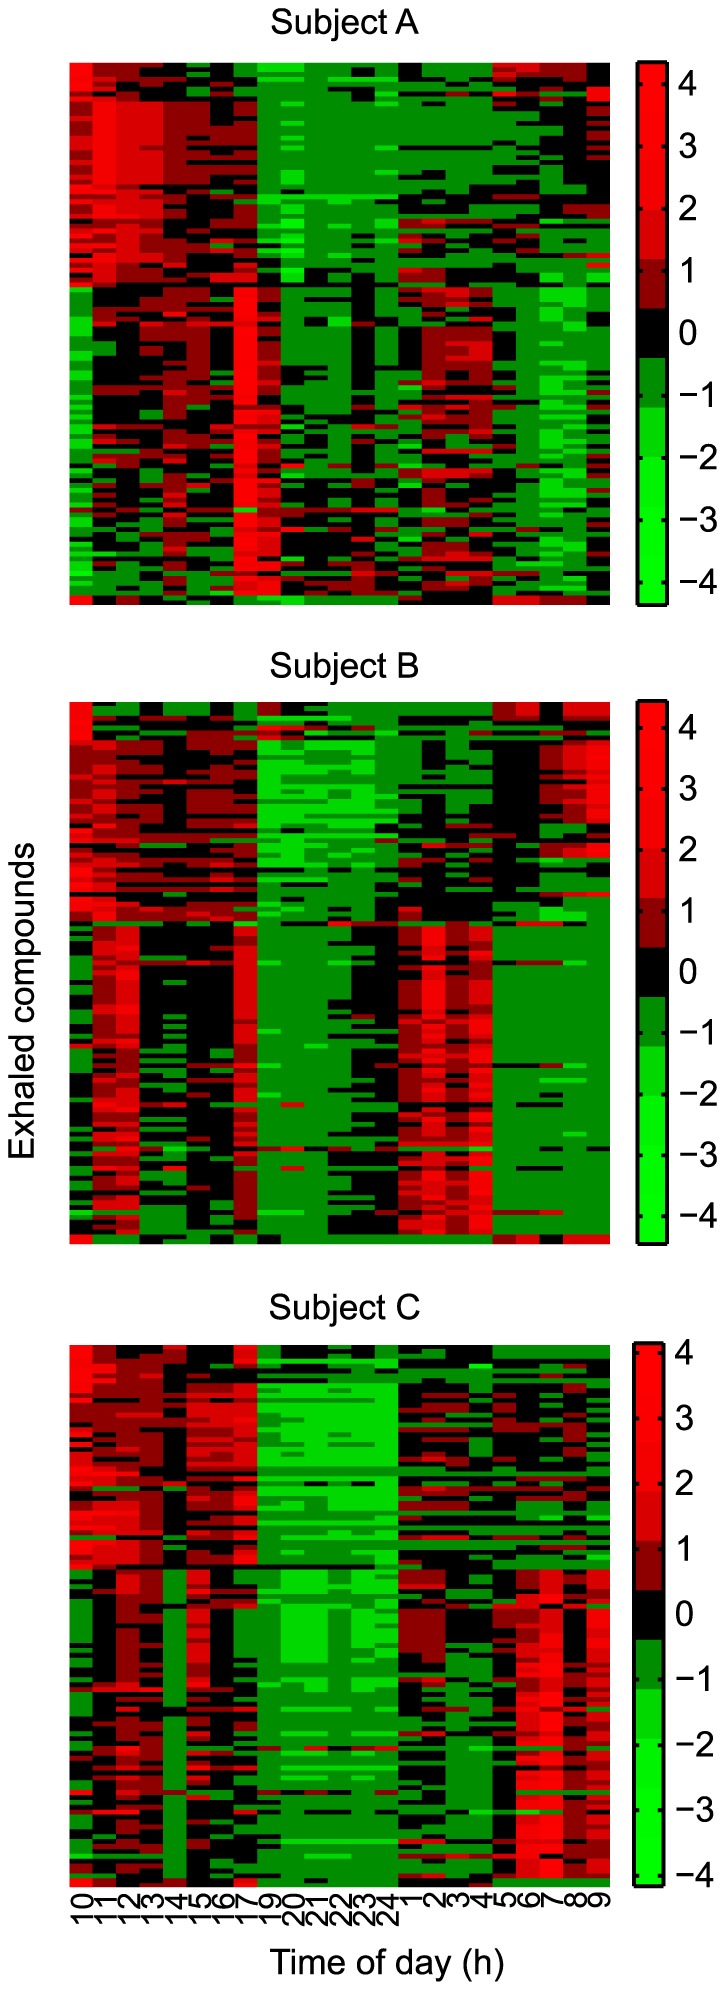
Figure 2. Individual heat-maps for all three participants at all times of all 111 features that were extracted from the spectrograms.

Order of metabolites in all three heat maps based on results of clustering of metabolites in Participant A.

Order of metabolites in all three heat maps based on results of clustering of metabolites in Participant A.