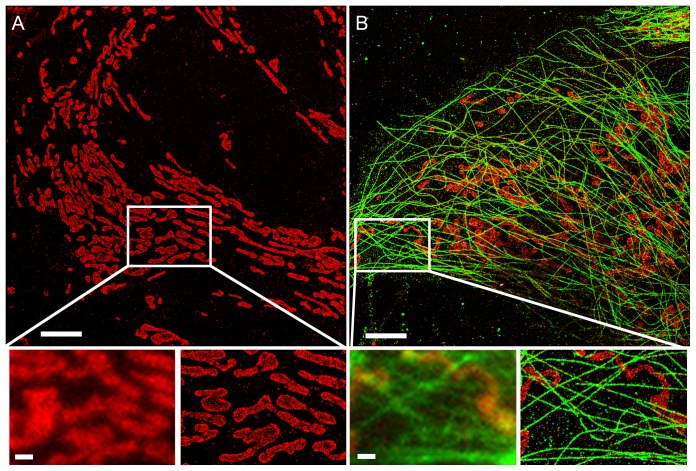
Figure 2. STORM microscopy in microfluidic chambers.
Samples were prepared using a setup for automated immunostaining. (A) One color STORM image of mitochondria (Tom20). (B) Two-color STORM image of mitochondria (Tom20) and microtubules (alpha-tubulin). In both panels, the zoomed region shows the same region imaged using conventional epifluorescence microscopy (left) and STORM (right). Scale bars, 5 µm in top images, and 1 µm in bottom images (zoomed regions).

