
Figure 3. Correlative microscopy using microfluidics.
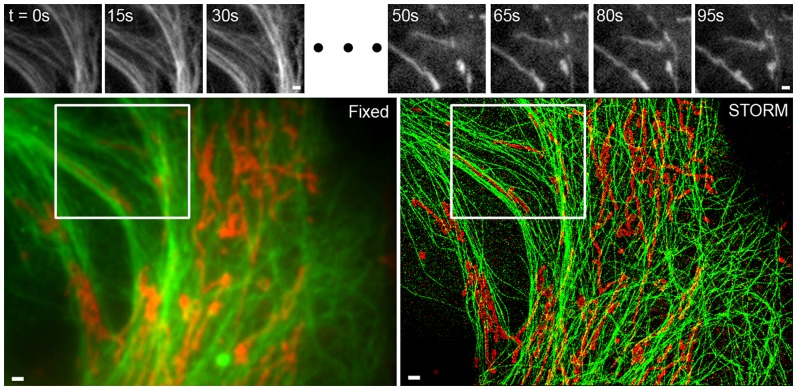
Microtubules and mitochondria were imaged sequentially using epifluorescence microscopy and STORM. The live imaging examples from various time points selected from a sequence of live cell images acquired at 100 ms per frame (top) are from the region inside the white boxes (bottom). The experimental sequence was as follows: live-cell imaging of microtubules (top left), followed by live-cell imaging of mitochondria (top right), on-stage automated fixation, automated immunostaining of mitochondria, epifluorescence imaging of mitochondria (bottom left, red), STORM of mitochondria (bottom right, red), automated immunostaining of microtubules, epifluorescence imaging of microtubules (bottom left, green), and STORM imaging of microtubules (bottom right, green). Since the STORM images were acquired sequentially, fiduciary beads were used to align the two images. Scale bars, 1 µm.