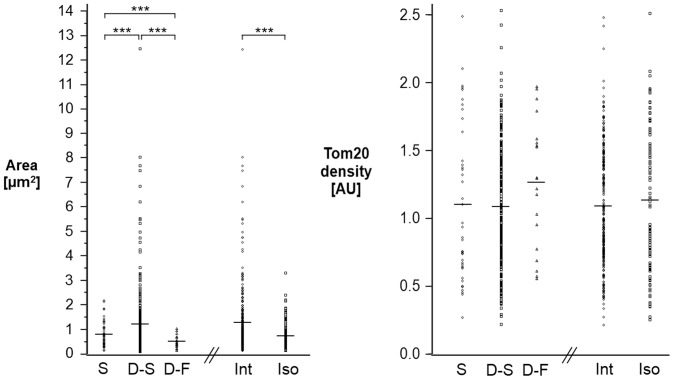
Figure 5. Mitochondrial dynamics in relation to size and protein distribution (S, Stationary, D-S, Dynamic-Slow, D-F, Dynamic-Fast; Int, Interacting, Iso, Isolated).
The average is indicated by a horizontal line. Tom20 density is given as the number of Tom20 localizations per unit area normalized to the overall median density. All dynamic categories were significantly different from each other in area (***, p<0.001), but were not significantly different in Tom20 density.

