
Figure 2. Characterization of Mettl3 knock out cells.
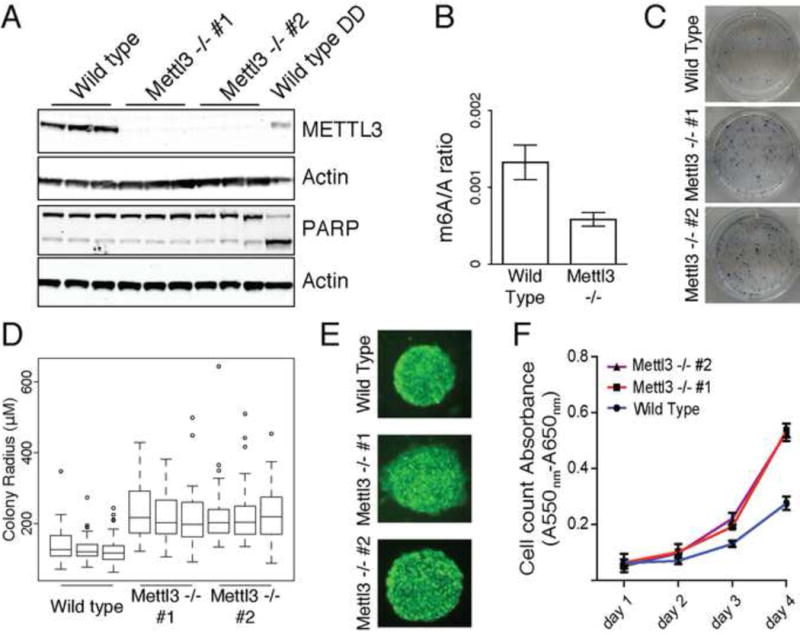
(A) Western blot for Mettl3 and PARP in wild type and two cell lines with CRISPR induced loss of protein (DD: DNA damaging agent). Actin is used as loading control. See also Figure S2A. (B) m6A ratio determined by 2D-TLC in wild type and Mettl3 KO. Error bars represent standard deviation of 3 biological replicates in all panels. See also Figure S2B and S2C. (C) Alkaline phosphatase staining of wild type and Mettl3 knock out cells. See also Figure S2D and S2E. (D) Box plot representation of colony radius for wild type and Mettl3 mutant cells. Experiments were performed in triplicate, with at least 50 colonies measured for each replicate. (E) Nanog staining of colonies of wild type and two cell lines with CRISPR induced loss of protein. (F) Cell proliferation assay of wild type and two cell lines with CRISPR induced loss of Mettl3 protein. See also Figure S2F, S2G and S2H.