
Figure 4. Impact of loss of Mettl3 on the mESC methylome.
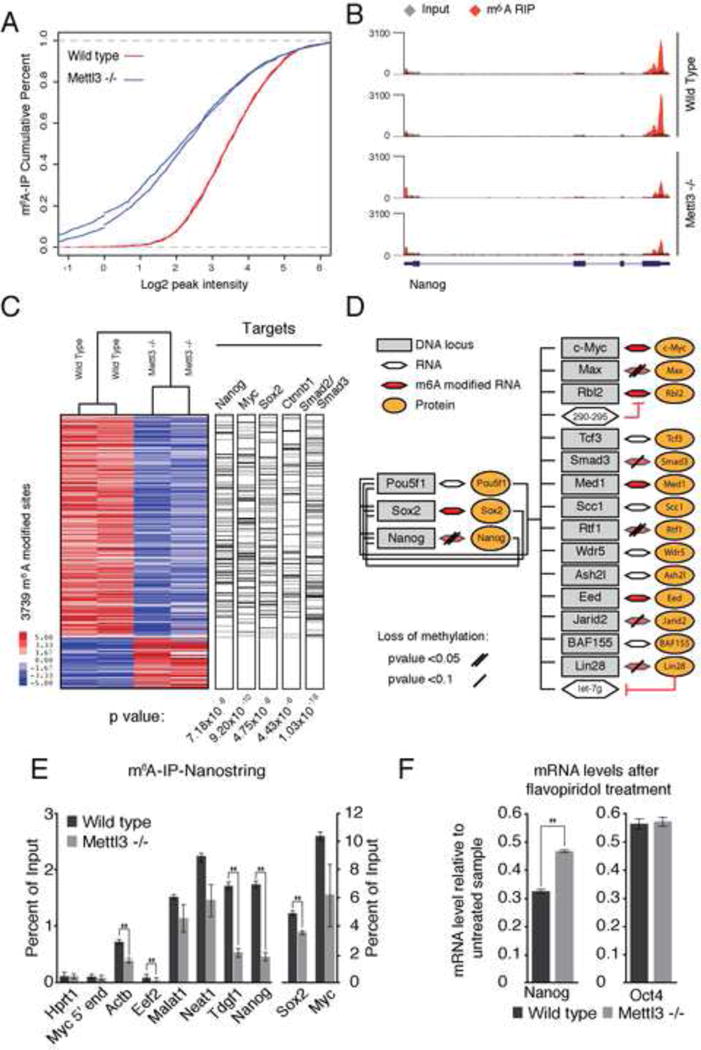
(A) Cumulative distribution function of log2 peak intensity of m6A modified sites. (B) Sequencing read density for input (grey) vs. in m6A IP (red) for Nanog. Y-axis represents normalized number of reads. Gene model as in Figure 1A. (C) Heatmap representing IP enrichment values for peaks with statistically significant difference between wild type and Mettl3 mutant. Bar to the right represent genes in each dataset with a >1.5 fold decrease in IP enrichment values. (D) Model of genes involved in maintenance of stem cell state (adapted from Young et al., 2011), representing transcripts with loss of m6A modification in Mettl3 −/− cells. (E) Percentage of input recovered after m6A IP measured by Nanostring for each mRNA. Error bars, standard deviation of 2 biological replicates. *, p-value < 0.05, t-test (2 tailed). (F) mRNA levels of Nanog and Oct4, measured by qRT-PCR, after PolII inhibition relative to untreated sample in wild type and Mettl3 KO cells. Error bars, standard deviation of 3 biological replicates. *, p-value < 0.05, t-test (2 tailed).